Friday, March 18, 2016

20160318


20160318 WEEKLY WRAP IN TRADER'S MAZE

-- WEEKLY NEWS AS SEEN ON NET


Energy sector defaults could go like dominoes - MarketWatch
http://www.marketwatch.com/story/energy-sector-defaults-could-go-like-dominos-2016-03-16
-- OIL Slide possible impact on Stocks


20160311 This is 'judgment day' for stocks: Technician
http://www.cnbc.com/2016/03/11/this-is-judgment-day-for-stocks-technician.html
-- and the result was above all bearish expectations

Goldman Warns Its Clients They Are Overlooking "The Largest Macro Market Risk" | Zero Hedge
http://www.zerohedge.com/...goldman-warns-its-clients-they-are-overlooking-largest-macro-market-risk

-- FEDERAL RESERVE INTEREST RATE - In this month just stayed unchanged.  FED lowered the expectations for U.S. Economicy. Hints on two possible raises this Year.


-- BONDS - Just rallying to New Highs.


 -- GLD - seeking for more buyers to come


-- VIX - Lower floor or rising channel / wedge signal risk taking appetite ascended


-- USD - Broken rising trendline


-- SPY - Heading towards 210


AND BONUS CHART ... W STANDS FOR "WIN"


 That's all for today. Good Luck & Good Trading

Friday, March 11, 2016

20160311


20160311 TRADER'S MAZE WEEKLY WRAP

What the week brought new from the technical point of view

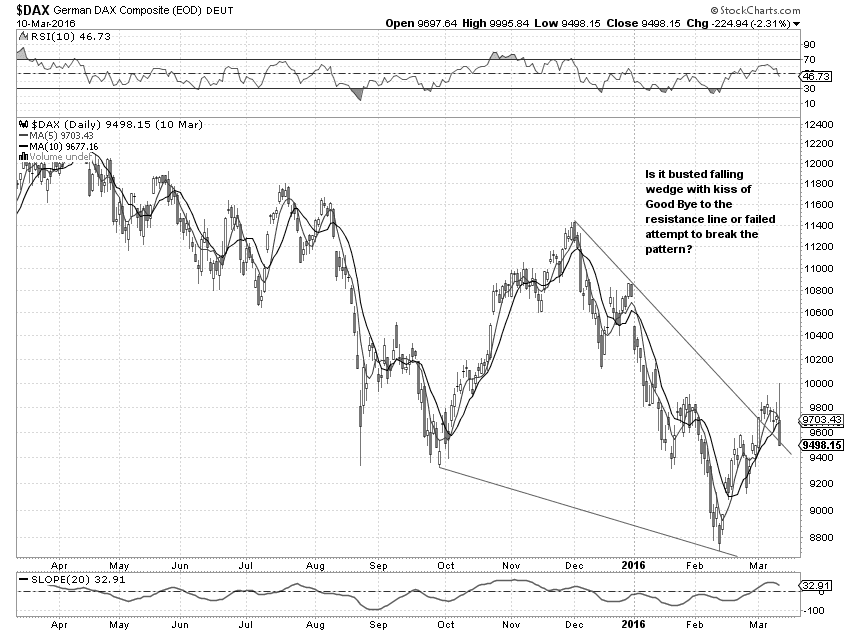
-- $DAX Busted falling wedge with kiss of Good Bye to the resistance line or failed attempt to break the pattern?


-- $HSI No change from last week ... China still in downtrend


-- $SPY Intraday


-- $SPY DAILY - it will now test important resistance


-- $GLD WEEKLY - Gold now quite oversold but it still holding to it's gains


-- $VIX - stays withing rising channel after bounced from the channel floor


From this week's headlines:

This 4,000-Year-Old Financial Indicator Says That A Major Crisis Is Looming | Zero Hedge
http://www.zerohedge.com/...s/2016-03-08/4000-year-old-financial-indicator-says-major-crisis-looming


And a bonus chart

-- The Origins of SP500 1850 support.


Sunday, March 6, 2016

20160603 Before the Market opens ($SPY, $HSI, $DAX)

--== 20160603 Before the Market opens ===---

-- HANG SENG seems to be in downtrend


-- DAX in hope from broken rising wedge

  
-- SPY Still holds it's firm support


-- Indexes Compared - Very different picture across the board


-- Only if the earnings will beat expectations


Take Care

Friday, March 4, 2016


20160304 TRADER'S MAZE WEEKLY WRAP

SPY & VIX & GOLD  OVERVIEW

-- SPY FROM MONTHLY HAS BROKEN THE RISING WEDGE DATED FROM 2009


-- SPY ON WEEKLY CHART FORMS A FALLING TRIANGLE WITH LOWERING VOLUME. I WOULD EXPECT SOME DOWNSIDE BACK TO THE SUPPORT.


-- VIX ON WEEKLY IN RISING CHANNEL (POSSIBLY WEDGE) NOW COULD BOUNCE FROM FLOOR OF THE CHANNEL


-- GOLD ON WEEKLY BROKEN IMPORTANT DOWNSIDE TRENDLINE. EVEN IT SEEMS OVERBOUGHT NOW POSSIBLY ENTERED A BULL MARKET


As Seen on the NET:

Why it’s good for investors to get paranoid right now - MarketWatch
http://www.marketwatch.com/story/why-its-good-for-investors-to-get-paranoid-right-now-2016-03-04

S&P 500 Forecast 2016
http://www.forecasts.org/stpoor.htm

Dax rally stalls at key 50% Fibonacci and weekly bear trend
https://www.tradingfloor.com/...s/dax-rally-stalls-at-key-50-fibonacci-and-weekly-bear-trend-7188333


Tuesday, May 5, 2015

Maze's Day Cycle

There is a daily routine in the maze. Get along with it. Wherever You are You have to know the European, American and Asian trading Hours. There are times when everyone is sleeping and time when everyone is very busy. The intersect between Asian and European and European and American is the busiest.

The volume grows bigger and the price is more likely to move. So it's just up to Your trading style if You are looking for more adrenaline or You decide to stay awake in night waiting for a percent.

The opening of market in each country gives opportunity to determine the direction for each market. So when You're trading American Timezone You can choose to go with the daily direction. There are days when it works. However sometimes the market just won't move and stays in a range. Good opportunity to buy low and sell highs. On the other side there are days when market it heading towards it's gains / losses in much bigger scale. On that days try to catch the trend.

You can choose to trade on certain hours. E.g. let's say You'll open a position before the Americans will close their markets. And wait for another day to find out whether You were right or wrong. This is called end of day trade. You can apply it to weeklies and trade on Friday. Or You can watch for cycles that repeats itself in a Yearly manner. So then just "Sell in May and go away".

Maze's Walls

Graphical representation of price has it's own walls and corners. It could be well defined by using the trend-lines. It has ceiling and floor. That's the support and resistance.

When You want to find Your way to maze's treasury. Just follow it. Use the graphical tools to draw a trend lines. Just connect lower low and next lower lows to determine the descending trend line. Or in uptrend connect higher high and next higher high to find an uptrending line. When in uptrend, just wait for price to break the trendline and short. Vice versa when in downtrend wait for price to break the descending line and buy the break.


Vertical lines could be usefull on higher timeframes to find the levels where some traders are stuck. Find highest highs and lowest lows and draw a vertical line to find supports (from lows) and resistances (from highs). Expect either bounce from this levels or it's breaks.

Use Channels to catch the trend. Just use trend line and then copy it to opposite extrema. So when You have a downtrend and You drawed the trend line heading down from highs use opposite lows on the opposite side of channel and move it there. You'll find a trend channel. Once the channel is established look for thirds of it's widht. In downtrend channel short it in upper third. In ascending channel buy at lower third. Once the downtrend channel is broken in the lower trend line get out from the position. Do no buy. Once the uptrend channel is broken in the upper trend line get out. Do not short.

Financial Market's Maze Surival Guide

To survive in Financial Markets You have to learn how to walk in the Maze. There are pits. There are traps. You can slip into the pit once trading too heavily. Or You can fall into the trap when letting Your position in negative profit. Or You can be trapped in losing streak.

To resist You need discipline. Do not hesitate to close Your position once You'll see nothing but loses for several candles. Use daily limits. Set it to capital divided by days You want to survive. Imagine You have 600$ capital. You want to survive for 30 days. So trade as many as 20$ loss per day at maximum.

Stick to winners. Once You'll see the position is winning move the stop loss to break-even as soon as possible. Set the target as multiply of initial stop loss. When Your stop is 50$ take as near as 200$ when possible.

Choose one or two markets and learn them well. You will experience that once You'll know the behaviour of the Symbol You'll get the advantage across other profit willing traders.

Choose Your style. Either You can buy low, sell high or You'll try to go with the trend. Generally the lower timeframes are more suitable for the prior one. So when on FX 5-minutes chart buy low and sell high. While on the Daily S&P catch the bull market and buy. Of course when stalking the trend it's best to buy pullbacks. So just wait when the market will come lower and buy.

Watch the Volume. It gives a lot of information regarding what are the smart money doing. High spikes volumes in oversold zone could potentionally mean reversal. Lowering volume in uptrend can signal it's losing breath.